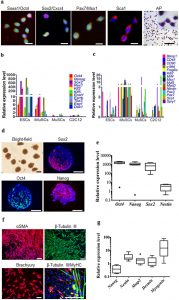
| (a) Representative immunofluorescent images of iMuSCs expressing Ssea1 (red), Oct4 (green), Sox2 (red), Cxcr4 (green), Pax7 (red), Msx1 (green), Sca1 (red), and alkaline phosphatase. Nuclei were stained with DAPI (blue). Scale bars = 10 and 200 μm. (b) qPCR analysis of iMuSCs for pluripotent marker genes and (c) myogenic marker genes. Data are represented as the mean ±SEM of 5 biological replicates. (d) Bright-field image of formed embryoid bodies (EBs) in suspension, and immunofluorescence staining of cryosectioned EBs. EBs contained cells positive for Sox2 (red), Oct4 (green), and Nanog (red). Nuclei were stained with DAPI (blue). Scale bar = 100 μm. (e) qPCR data showed upregulation of Oct4, Nanog, Sox2, and no change of Nestin expression compared to control undifferentiated iMuSCs. (f) Immunofluorescence images of differentiated EBs expressing αSMA (red), β-Tubulin III (green), Brachyury (red), and β-Tubulin III β (red) with MyHC (green). Nuclei were stained with DAPI (blue). Scale bar = 100 μm. (g) qPCR data of 7 days differentiated EBs show Nestin, Mtap2, Desmin, and Myogenin upregulation, and Nanog downregulation compared to control undifferentiated iMuSCs. All qPCR data was analyzed by the delta-delta Ct method, and are represented as the mean ±SEM of 5 biological replicates. |

